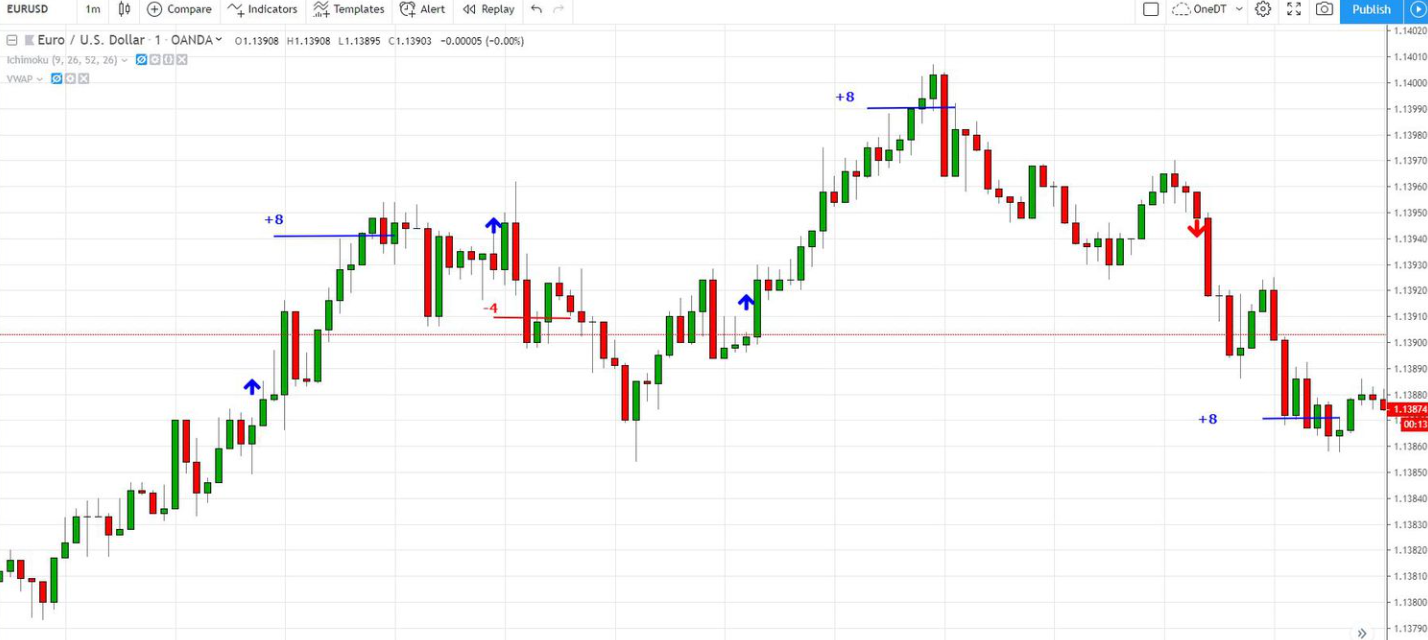
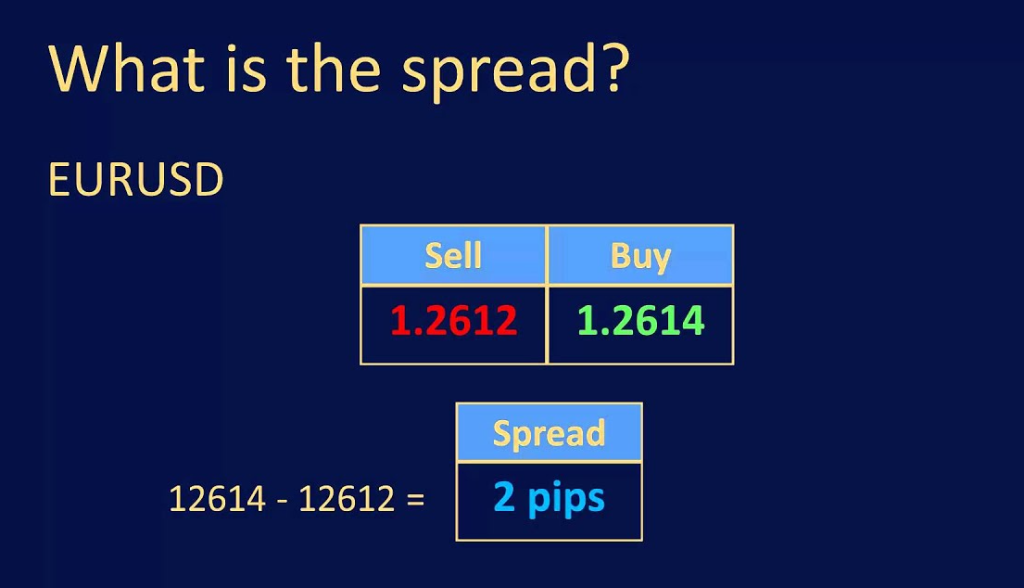
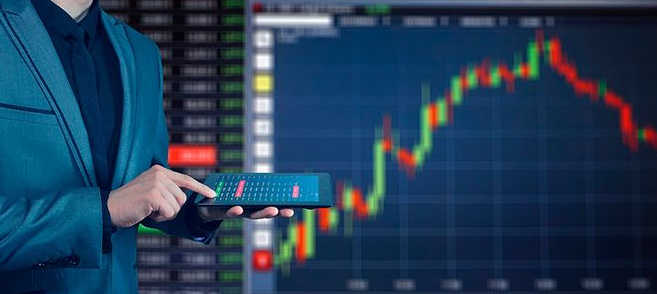
Forex charts are graphical representations of the price movements of currency pairs in the foreign exchange market. Forex charts are used by traders to analyze market trends, identify potential trade opportunities, and make informed trading decisions. Charts come in di fferent types and styles, and can be customized according to the trader’s preferences and needs.
Forex chart are an essential tool for traders in the foreign exchange market. They provide a visual representation of price movements over time, allowing traders to identify patterns and trends that may not be visible in other forms of market analysis.
Types of Forex Charts
There are several types of forex chart, including:
- Line Charts: Line charts display the price movements of a currency pair over time as a continuous line. Line charts are simple and easy to read, making them a popular choice among traders who are new to forex charting.
- Bar Charts: Bar charts display the price movements of a currency pair over time as vertical bars. Each bar represents a specific time period (such as a day, hour, or minute) and contains information about the opening, closing, high, and low prices for that period. Bar charts are useful for identifying price ranges and patterns.
- Candlestick Charts: Candlestick charts the price movements of a currency pair over time as a series of candlesticks. Each candlestick represents a specific time period (such as a day, hour, or minute) and contains information about the opening, closing, high, and low prices for that period. Candlestick charts are useful for identifying price trends and patterns.
- Renko Charts: Renko charts the price movements of a currency pair over time as a series of bricks. Each brick represents a specific price range and is either colored green (bullish) or red (bearish) depending on the di rection of the trend. Renko charts are useful for identifying long-term trends and filtering out noise.

How to Read Forex Charts
Reading forex charts can be intimidating for traders who are new to the foreign exchange market. However, with a little practice and patience, anyone can learn to read forex chart effectively. Here are some tips for reading forex chart:
- Identify the currency pair: The first step in reading a forex chart is to identify the currency pair being di splayed.
- Choose a time frame: Forex can be displayed in time frames, such as daily, hourly, or minute-by-minute. Choose a time frame that suits your trading style and strategy.
- Identify the price: The price is di splayed on the vertical axis of the chart. Look for patterns and trends in the price movements.
- Use technical indicators: Technical indicators such as moving averages, MACD, and RSI can help traders identify patterns.
- Practice: Reading forex chart takes practice and experience. Keep practicing and refining your skills until you feel comfortable reading forex chart on your own.

Benefits of Using Forex Charts
Forex chart offer several benefits to traders, including:
- Visual representation of price movements: Forex provide a visual representation of price movements over time, making it easier for traders to identify patterns and trends.
- Easy to use: Forex are easy to use and can be customized to suit the trader’s preferences and needs.
- Multiple time frames: Forex can be displayed in multiple time frames.
- Technical analysis: Forex can be used in conjunction with technical indicators to identify patterns and trends in the price movements.
- Real-time updates: Forex can be updated in real-time, providing traders with up-to-date information about market trends and conditions.

Conclusion
Forex charts are an essential tool for traders in the foreign exchange market. They provide a visual representation of price movements over time, allowing traders to identify patterns and trends that may not be visible in other forms of market analysis. There are several types of forex chart, including line charts, bar charts, candlestick charts, and Renko charts. Reading forex chart takes practice and patience, but anyone can learn to read them effectively with a little effort. Forex offer several benefits to traders, including visual representation of price movements, ease of use, multiple time frames, technical analysis, and real-time updates.
Suggestions
As a suggestion, traders should use forex charts as a tool to help them make informed trading decisions in the foreign exchange market. However, they should not rely solely on forex charts for their trading decisions. Traders should also use other forms of market analysis, such as fundamental analysis and news events, to confirm their trading decisions. In addition, traders should always use proper risk management techniques to protect their investments and avoid large losses. By combining forex charts with other forms of market analysis and proper risk management techniques, traders can increase their chances of success in the foreign exchange market.


