In the world of forex trading, online forex charts play a crucial role in analyzing currency trends and making informed trading decisions. A forex chart is a graphical representation of the price movement of a currency pair over a specific period of time. By studying these charts, traders can identify patterns, trends, and potential entry or exit points for their trades. In this article, we will explore the importance of Chart Forex Online and how they can be used effectively in your trading strategy.
The Benefits of Online Forex Charts

Online forex charts offer several advantages for traders:
- Visual Representation: Forex charts provide a visual representation of currency price movements, making it easier to analyze and interpret market trends.
- Historical Data: By examining past price movements displayed on the chart, traders can gain insights into how a currency pair has behaved in the past and use that information to predict future price movements.
- Technical Analysis: Forex charts are essential tools for conducting technical analysis, which involves using indicators, chart patterns, and other mathematical calculations to identify potential trading opportunities.
- Real-Time Updates: Online forex charts provide real-time data, allowing traders to stay updated with the latest price movements and react quickly to market changes.
Types of Online Forex Charts
1. Line Chart

A line chart is the simplest form of forex chart. It connects the closing prices of a currency pair over a specified time period, forming a continuous line. Line charts are useful for providing a general overview of price trends and identifying support and resistance levels.
2. Bar Chart

A bar chart provides more detailed information compared to a line chart. Each bar on the chart represents a specific time period and displays the opening, closing, high, and low prices of the currency pair. Bar charts are useful for analyzing price volatility and identifying key price levels.
3. Candlestick Chart

Candlestick charts are widely used by forex traders due to their ability to provide detailed information about price movements. Each candlestick represents a specific time period and displays the opening, closing, high, and low prices. The body of the candlestick is filled or hollow, indicating whether the price has increased or decreased during that time period. Candlestick patterns can provide valuable insights into potential trend reversals and continuation patterns.
Using Online Forex Charts Effectively
To make the most of online forex charts, here are some tips for effective usage:
1. Choose the Right Timeframe
Online forex charts offer various timeframe options, such as daily, weekly, or even minute-based charts. Select the timeframe that aligns with your trading strategy and objectives. Shorter timeframes provide more detailed information, while longer timeframes offer a broader view of the market.
2. Use Technical Indicators
Online forex charts allow you to overlay technical indicators to enhance your analysis. Popular indicators include moving averages, MACD, RSI, and Fibonacci retracement levels. Experiment with different indicators to find the ones that work best for your trading style.
3. Identify Support and Resistance Levels
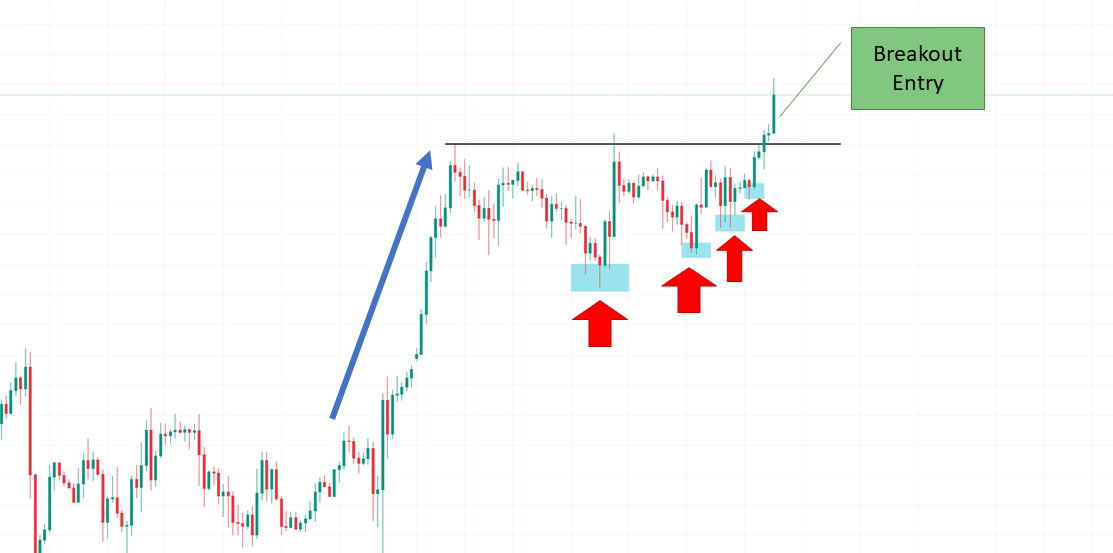
Support and resistance levels are key areas on the chart where price tends to stall or reverse. By identifying these levels, you can anticipate potential entry or exit points for your trades. Look for areas where price has historically struggled to break through or has found consistent support.
4. Spot Chart Patterns
Chart patterns, such as triangles, head and shoulders, and double tops/bottoms, can provide valuable insights into potential market reversals or continuation patterns. Learn to recognize these patterns on the chart and use them to your advantage when making trading decisions.
5. Combine with Fundamental Analysis
While online forex charts are useful for technical analysis, it’s important to consider fundamental factors as well. Stay updated with economic news, geopolitical events, and central bank announcements that may impact currency prices. Combining technical and fundamental analysis can provide a more comprehensive view of the market.
Conclusion
Online forex charts are powerful tools for analyzing currency trends and making informed trading decisions. By using different chart types, technical indicators, and analyzing support/resistance levels and chart patterns, you can gain valuable insights into the market and improve your trading performance. Remember to combine technical analysis with fundamental analysis for a well-rounded approach to forex trading.
Suggestion
To enhance your chart analysis skills, dedicate time to study and practice using different chart types and indicators. Keep a trading journal to track your observations and learn from your trades. Additionally, consider attending webinars, reading books, or participating in online forums to expand your knowledge and interact with fellow traders.


